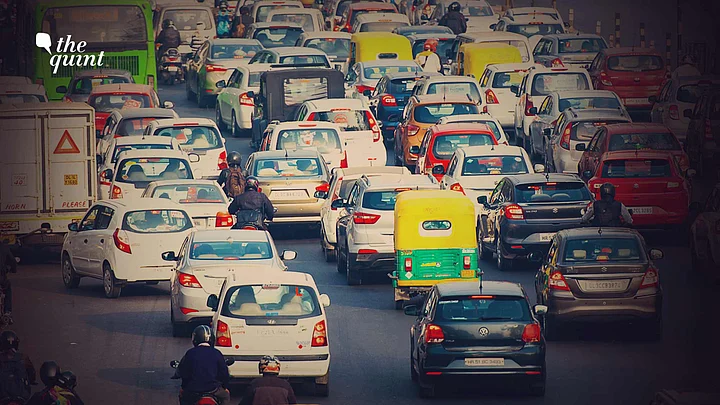
The past few years, no thanks to the COVID-19 pandemic, have seen a rise in the number of personal vehicles on the road. As a corollary, traffic snarls have also become more common.
A study conducted by a United Kingdom (UK)-based company, Select Car Leasing, shows that an Indian driver spends not merely many tedious hours, but almost two entire days stuck in traffic per year.
And that's not all.
The traffic research, which measured the length of road and the number of vehicles per country as the primary parameters for its analysis, has a bunch of other startling findings about India.
India Has the Highest Number of Registered Vehicles
The UK-based study, which takes into consideration top 50 countries with highest Gross Domestic Product (GDP), shows that India has the highest number of registered vehicles in the world.
Data from the research indicates that India has 296 million vehicles. India is closely followed by China and the United States (US), which have about 292 million and 276 million registered vehicles, respectively.
On an average, the 50 nations with the highest GDP have 33.67 million vehicles.
India's Road Length Among Highest in the World
The study has ranked India as having the third largest length of legal carriageway among the countries taken into consideration.
As per the study, India has 29,20,000 miles, or 46,99,284.48 km of roadways. Of the 50 countries, only the US and China rank higher than India on this parameter.
While 40,93,000 miles of roadways traverse the US, China has 30,83,000 miles of roadways.
The nations taken into consideration have 4,51,000 miles of roadways on an average.
Even With Highest Number of Vehicles, India Ranks 18th on Traffic Jam Indices
1. Ranking by Vehicles per Mile
The study finds that India, with 101 vehicles per mile of road, falls at the 18th position in the traffic index.
The average vehicles per mile was much higher at 123.
Surprisingly, even as India has the highest number of registered vehicles, it falls only around the middle of this index.
China, which has the second highest number of registered vehicles, has 95 vehicles per mile and ranks 20th. The US is ranked at 29.
While the United Arab Emirates (UAE) has the most vehicles per mile at 850, Bangladesh has the least at 1.
2. Ranking by Time Spent in Traffic
Additionally, the research posits that an Indian driver spends 2.02 days per year in traffic jams, on an average.
This period accounts for the time a driver spends sitting stationary behind the wheel.
On this index, India ranks 18th again, falling a little below the average of 2.46 days spent in traffic/year.
India is closely followed by China, which ranks 20th, with 1.88 days in traffic. In the US, a driver spends an average of 1.34 days in traffic.
While the UAE tops the chart again with 16.91 days in traffic, a driver in Bangladesh spends 0.02 days in traffic per year.
Growth of Roads, Vehicles in India: What Data Shows
A Ministry of Road Transport and Highways (MoRTH) report, citing data from the 2011 Census, indicates that India had 4.87 km of road for 1,000 persons in 2017.
The total carriageway of the country increased significantly from 3.99 lakh in 1951 to 63.86 lakh in 2019, expanding at a compound annual growth rate (CAGR) of 4.22 percent.
Of the various categories of roadways in India, the national highways account for 1,36,440 km of the road length, the state highways comprise 1,76,818 km of road, while other stretches of carriageway add up to 59,02,539 km.
As per the latest annual report of the MoRTH, published in 2021, India had as many as 295.7 million registered motor vehicles by 2019.
Of these, roughly 221 million were two-wheelers, 38 million were cars, jeeps and taxis, and 2 million were buses.
The annual growth rate of registered motor vehicles in India was determined to be 9.91 percent.
(At The Quint, we question everything. Play an active role in shaping our journalism by becoming a member today.)
