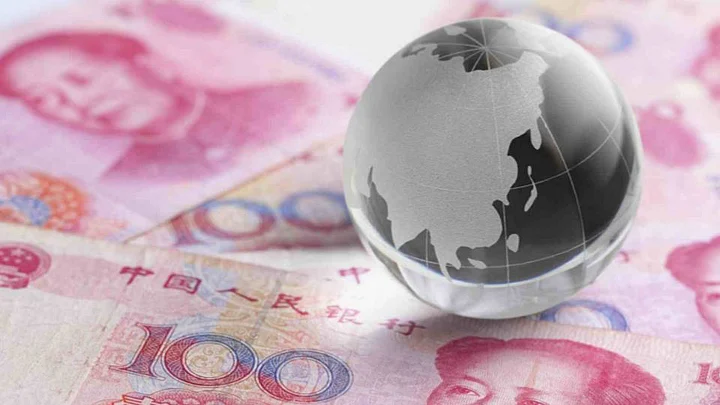
After 30 years of sub-normal growth, the Chinese economy has started slowing over the past 2 years. The Chinese government has been trying to shift the economy from an investment and export-fuelled one to a more consumption-driven one. However, this shift will not be a smooth one, according to an Edelweiss report.
The Quint brings you 7 charts from the Edelweiss report that show all is not well with the Chinese economy.
Investment is Slowing Down
While investments have started slowing, consumption has not picked up pace either. Investments as a percentage of GDP have fallen to 45.4%.
Trade Adversely Affected
China’s attempts at shifting the focus of its economy has adversely impacted exports.
Increasing Debt Coupled with Housing Price Fall
China’s debt has quadrupled since 2007 and is currently 282% of GDP. In fact, China’s increase in debt-to-GDP ratio from 2007-2014, is the fifth highest in the world. The external debt has also catapulted 6 times in the past 7 years. Yet another reason for concern is that 50% of the debt is linked to the real estate sector which has been slowing down significantly.
Commodity Prices
China is the world’s largest consumer of commodities. A slowdown in China inadvertently results in a fall in global commodity prices. China imports $270 bn of Crude and $104 bn of Iron ore. The past year has seen huge falls in commodity prices. Crude prices have fallen 60% in the last year while copper prices are at a 6-year low. Iron ore and Coal have also fallen 59% & 26% respectively.
Ripple Effect Across Markets
China being the world’s 2nd largest economy contributes 14% to the world’s GDP and 50% to the world’s GDP growth. Hence, a slowdown in such a major economy is likely to have a ripple effect across the globe. For Australia, China accounts for around one-third of all exports and for the Sub-Saharan African region, China is the largest trade partner.
Other commodity exporting regions like Brazil, Latin America and Russia are being negatively impacted. The above factors have led to the VIX index (indicator of global volatility) soaring. This has resulted in risk aversion across the globe with foreign investors exiting emerging markets.
(At The Quint, we question everything. Play an active role in shaping our journalism by becoming a member today.)
